User interface - variable calculator
In the Variable Calculator function, when numerical variables (facets) are present, you can select a numerical facet and choose the desired calculation method from the available options. Then, enter a name for the result to create a new variable. After clicking Compute, the result will appear as a new facet in the dataset.
Where to Find the Variable Calculator

The Variable Calculator button, located in the toolbar, looks like a small calculator icon.
Creating a New Variable

To create a new facet (variable), enter a name in the input box and select one or more numerical facets to compute with. You can chain operations together, add more by clicking the green “+” icon, and click the red “Compute” button to generate your result.
Selecting Numerical Facets
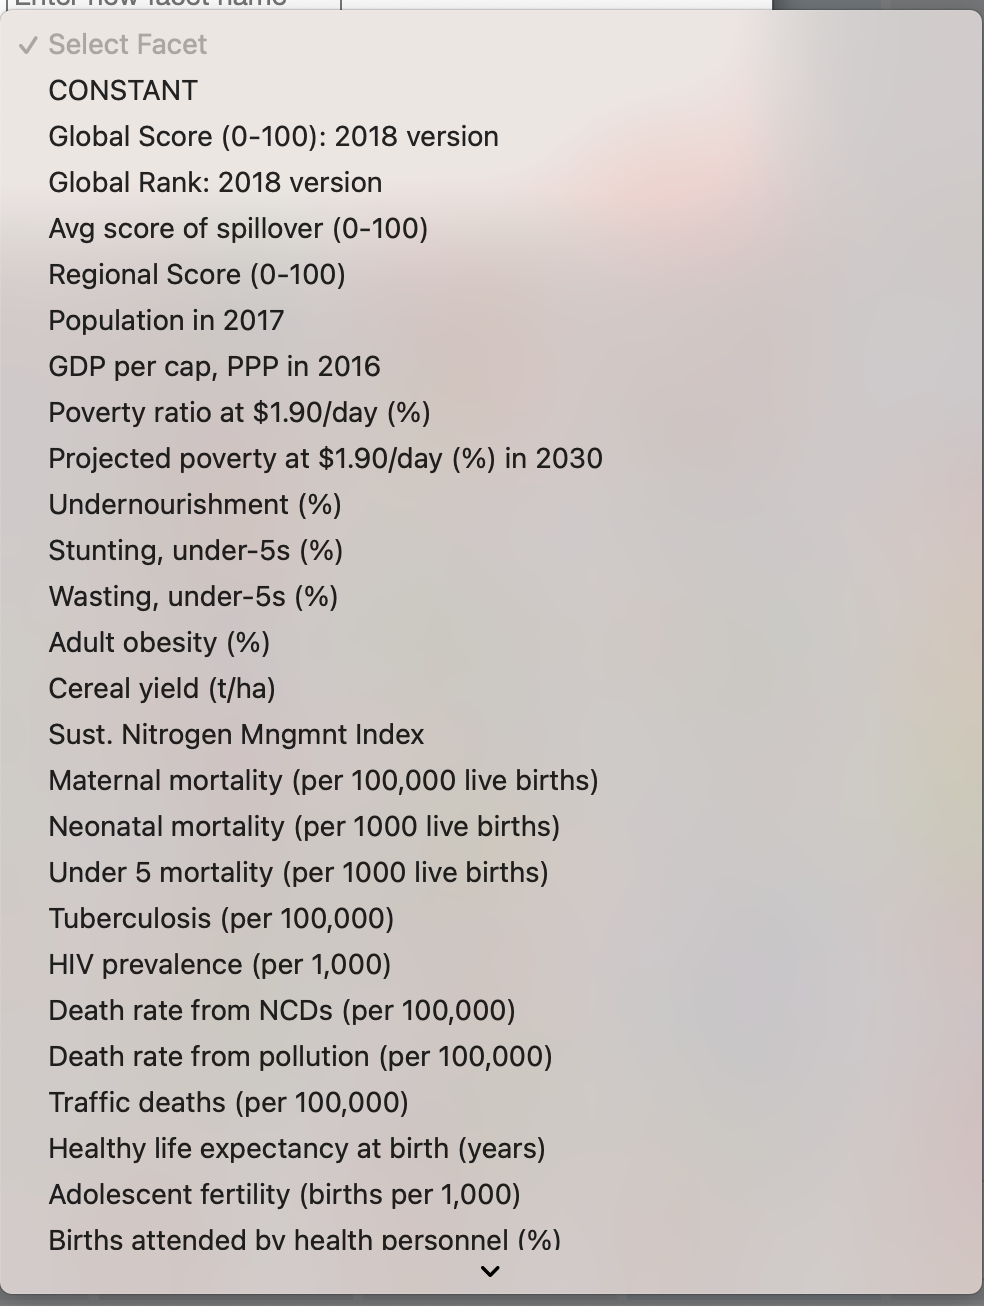
When clicking the facet dropdown, you’ll see a list of available variables. These include indicators such as:
GDP per cap, PPP in 2016Poverty ratio at $1.90/day (%)Stunting, under-5s (%)Traffic deaths (per 100,000)Healthy life expectancy at birth (years)Goal 3 Score(related to health and well-being)
You can select any of these for operations like addition, subtraction, multiplication, division, or monadic functions such as summation or negation.
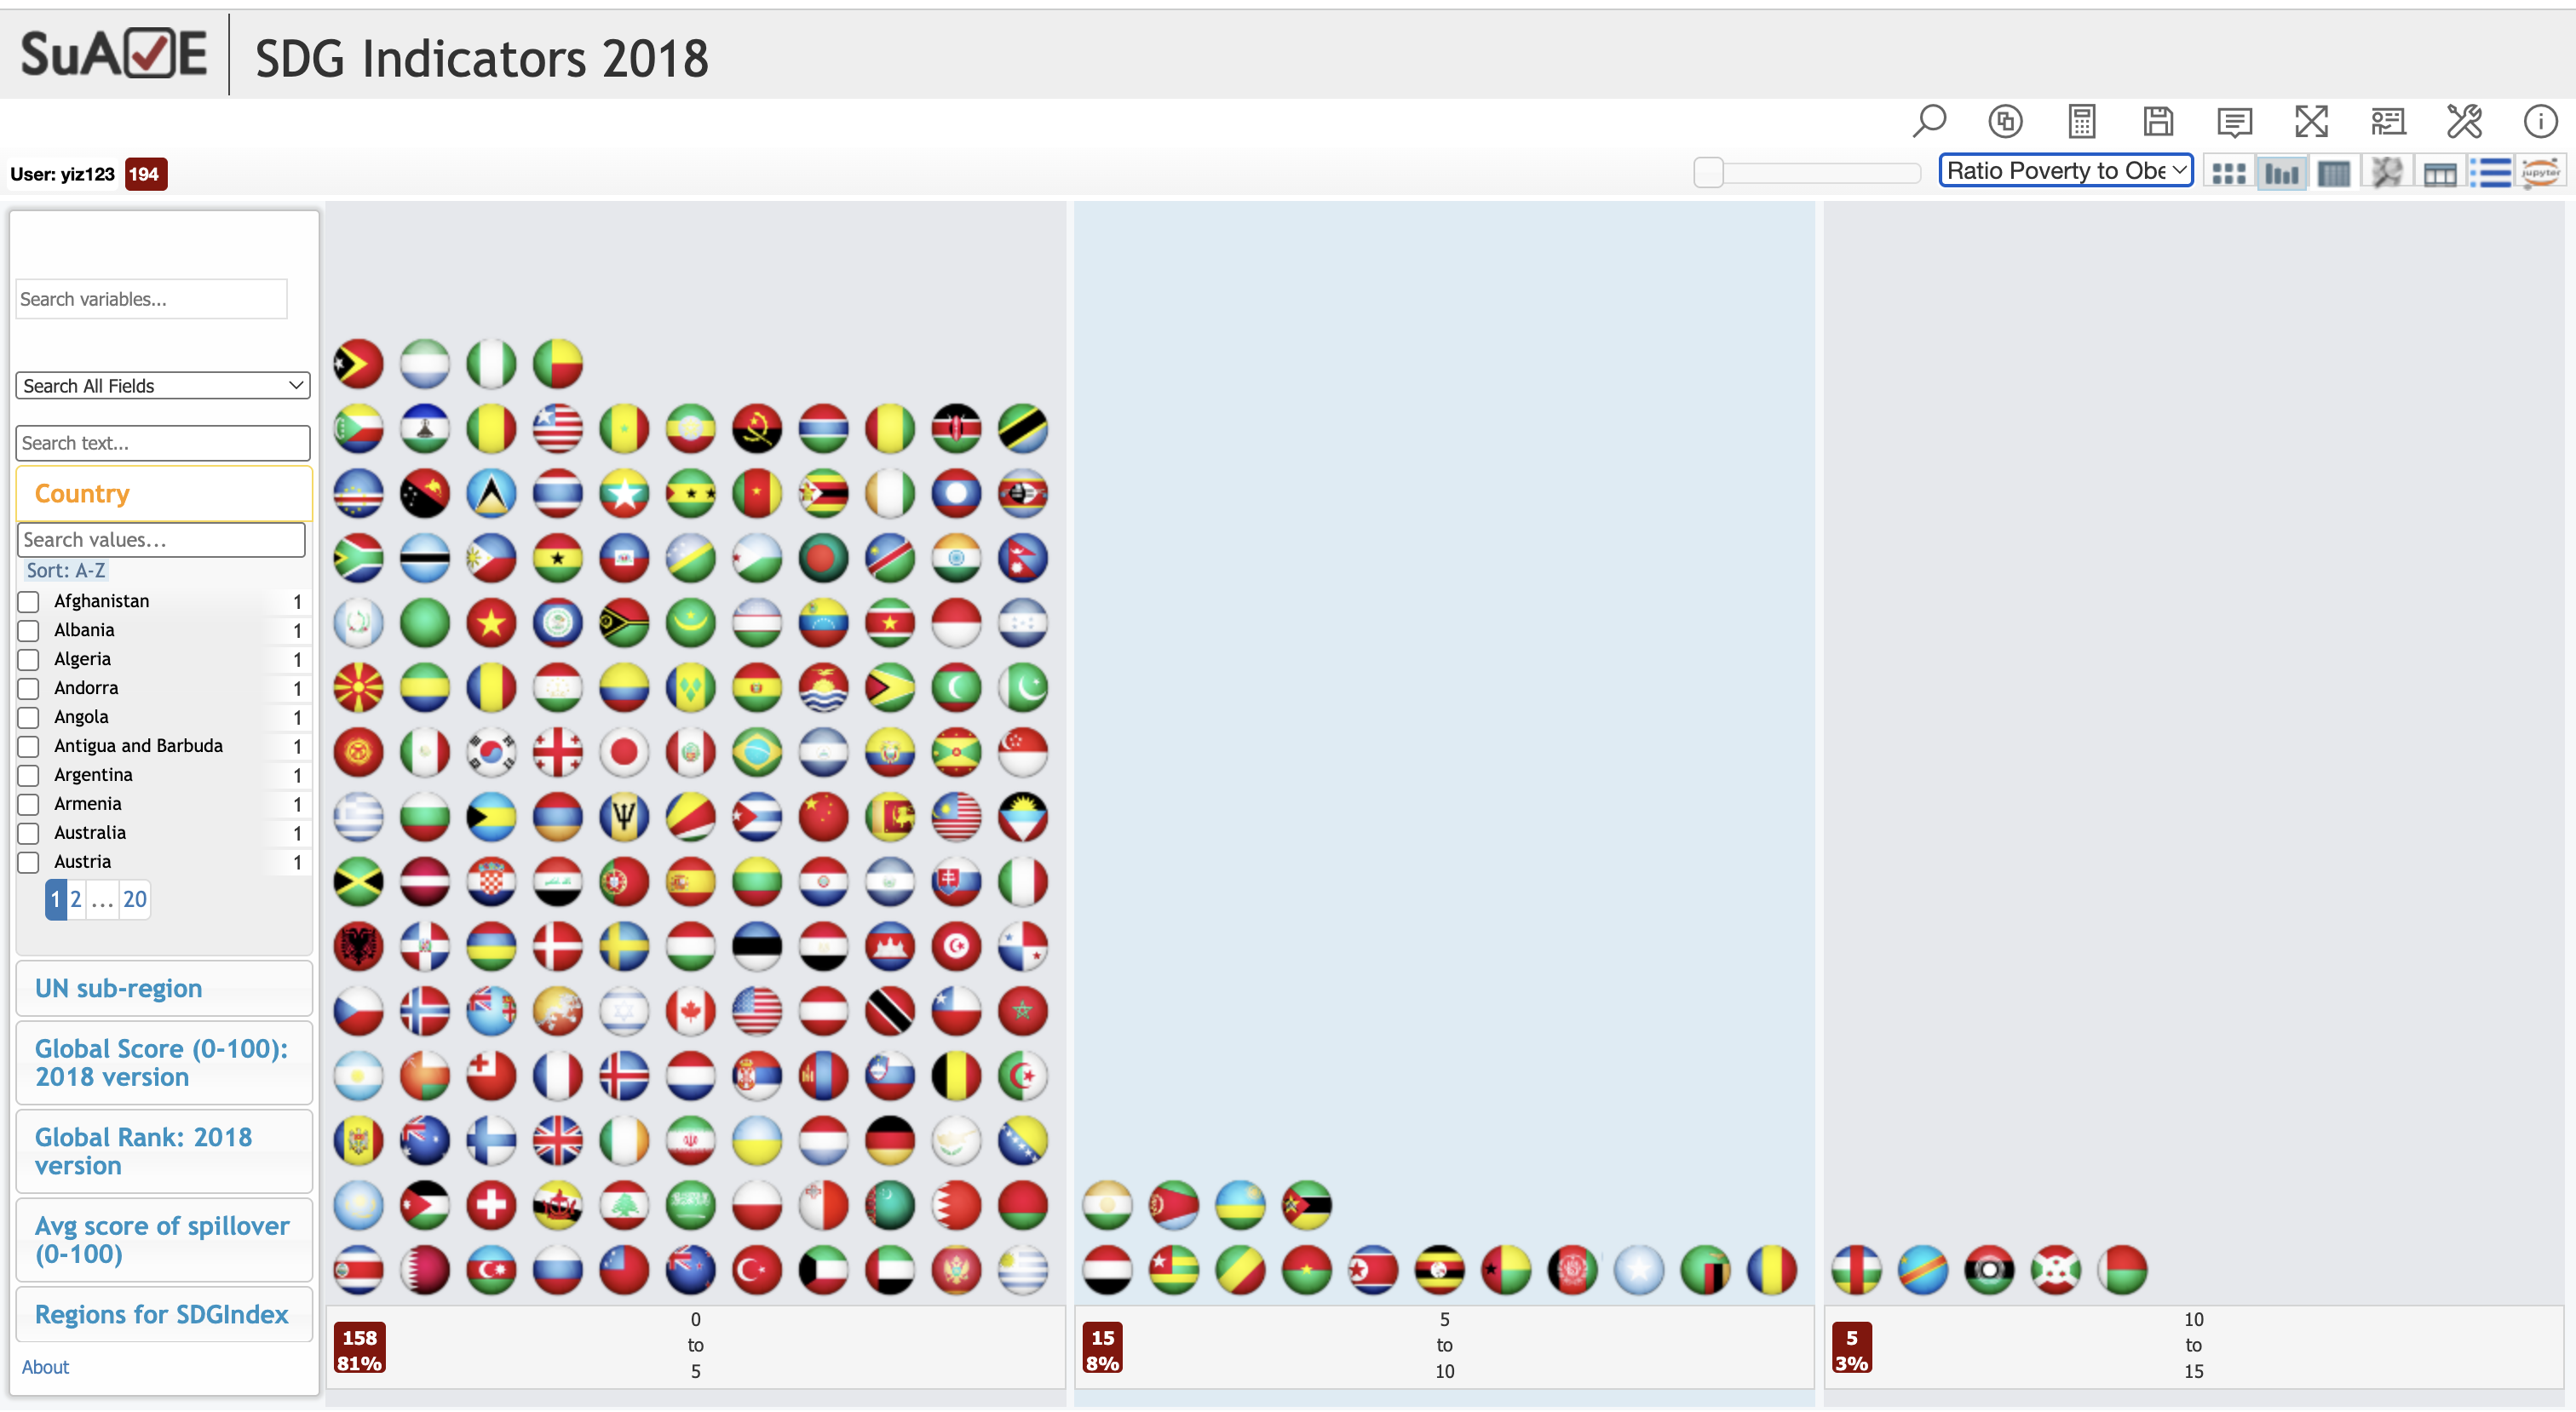
Example Calculation
Let’s say we want to calculate a ratio between two variables:
poverty_ratio_per_gdp = [Poverty ratio at $1.90/day (%)] ÷ [GDP per cap, PPP in 2016]
More Examples
Example 1: Poverty per GDP Dollar
- Variables:
- Poverty ratio at $1.90/day (%)
- GDP per cap, PPP in 2016
- Formula:
poverty_per_gdp = Poverty ratio / GDP per cap - Interpretation:
Measures how much poverty exists per unit of economic output per person.
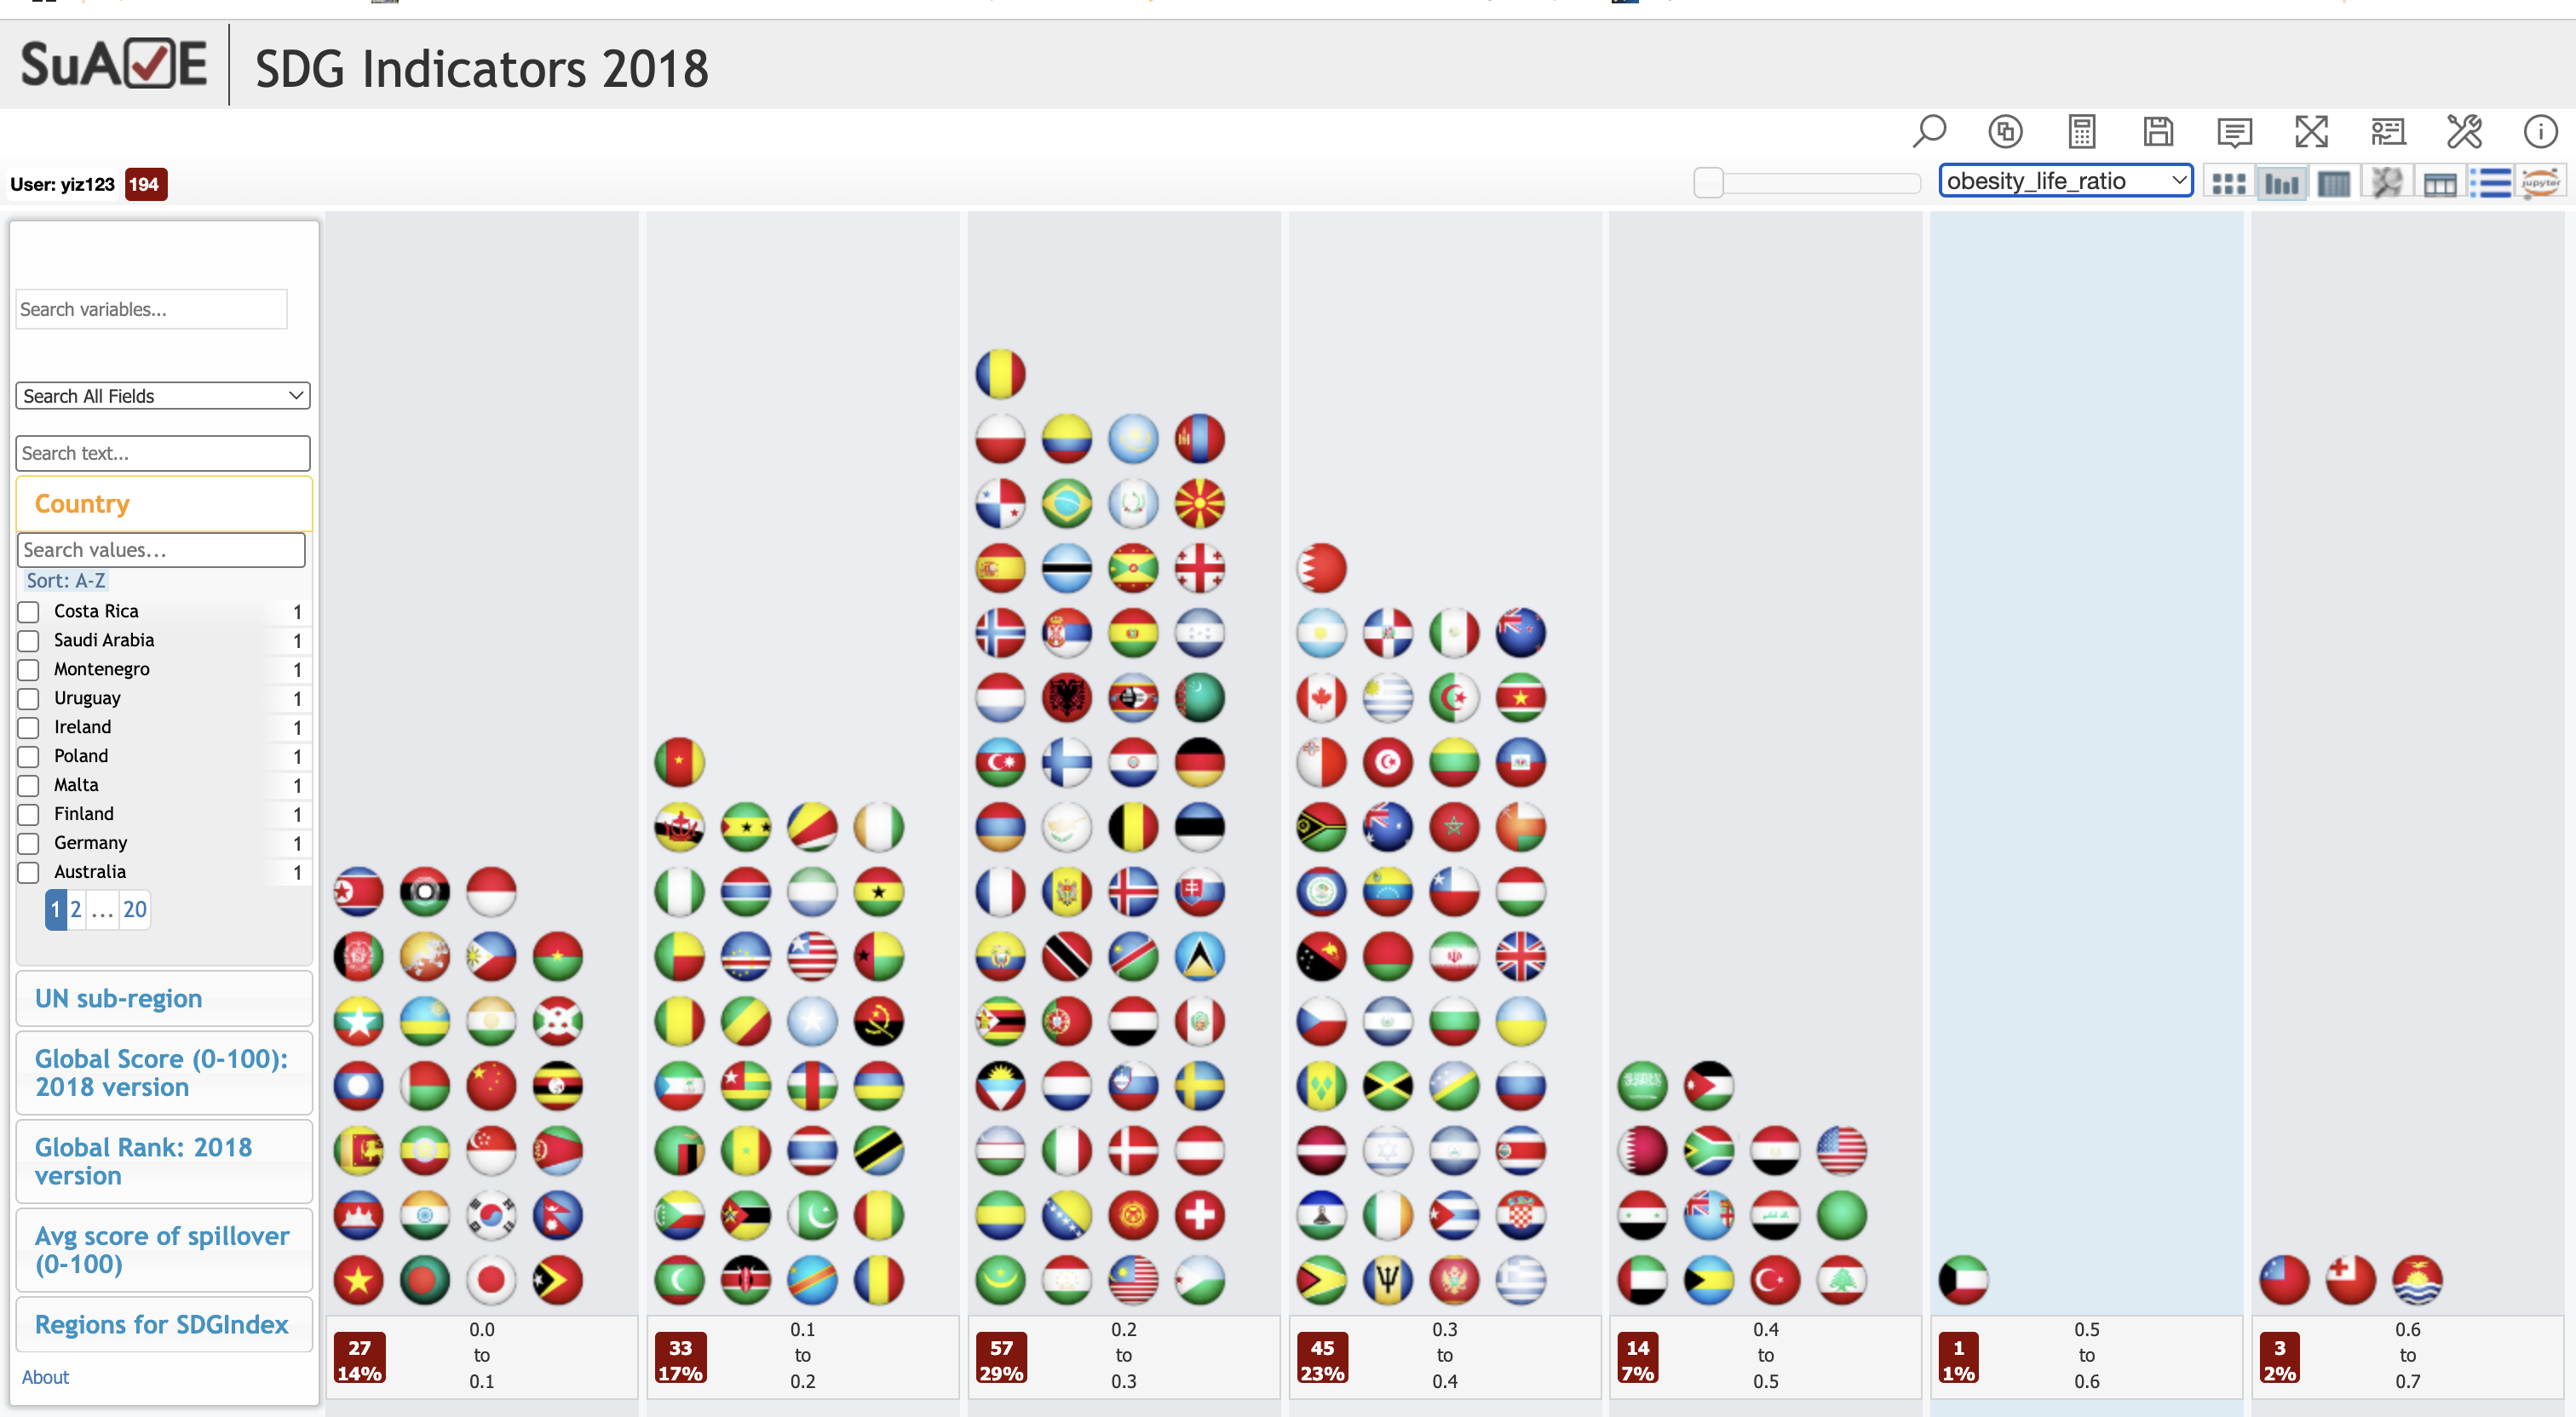
Example 2: Obesity vs. Life Expectancy
- Variables:
- Adult obesity (%)
- Healthy life expectancy at birth (years)
- Formula:
obesity_life_ratio = Adult obesity / Life expectancy - Interpretation:
Gives a normalized view of obesity burden relative to how long people live healthily.
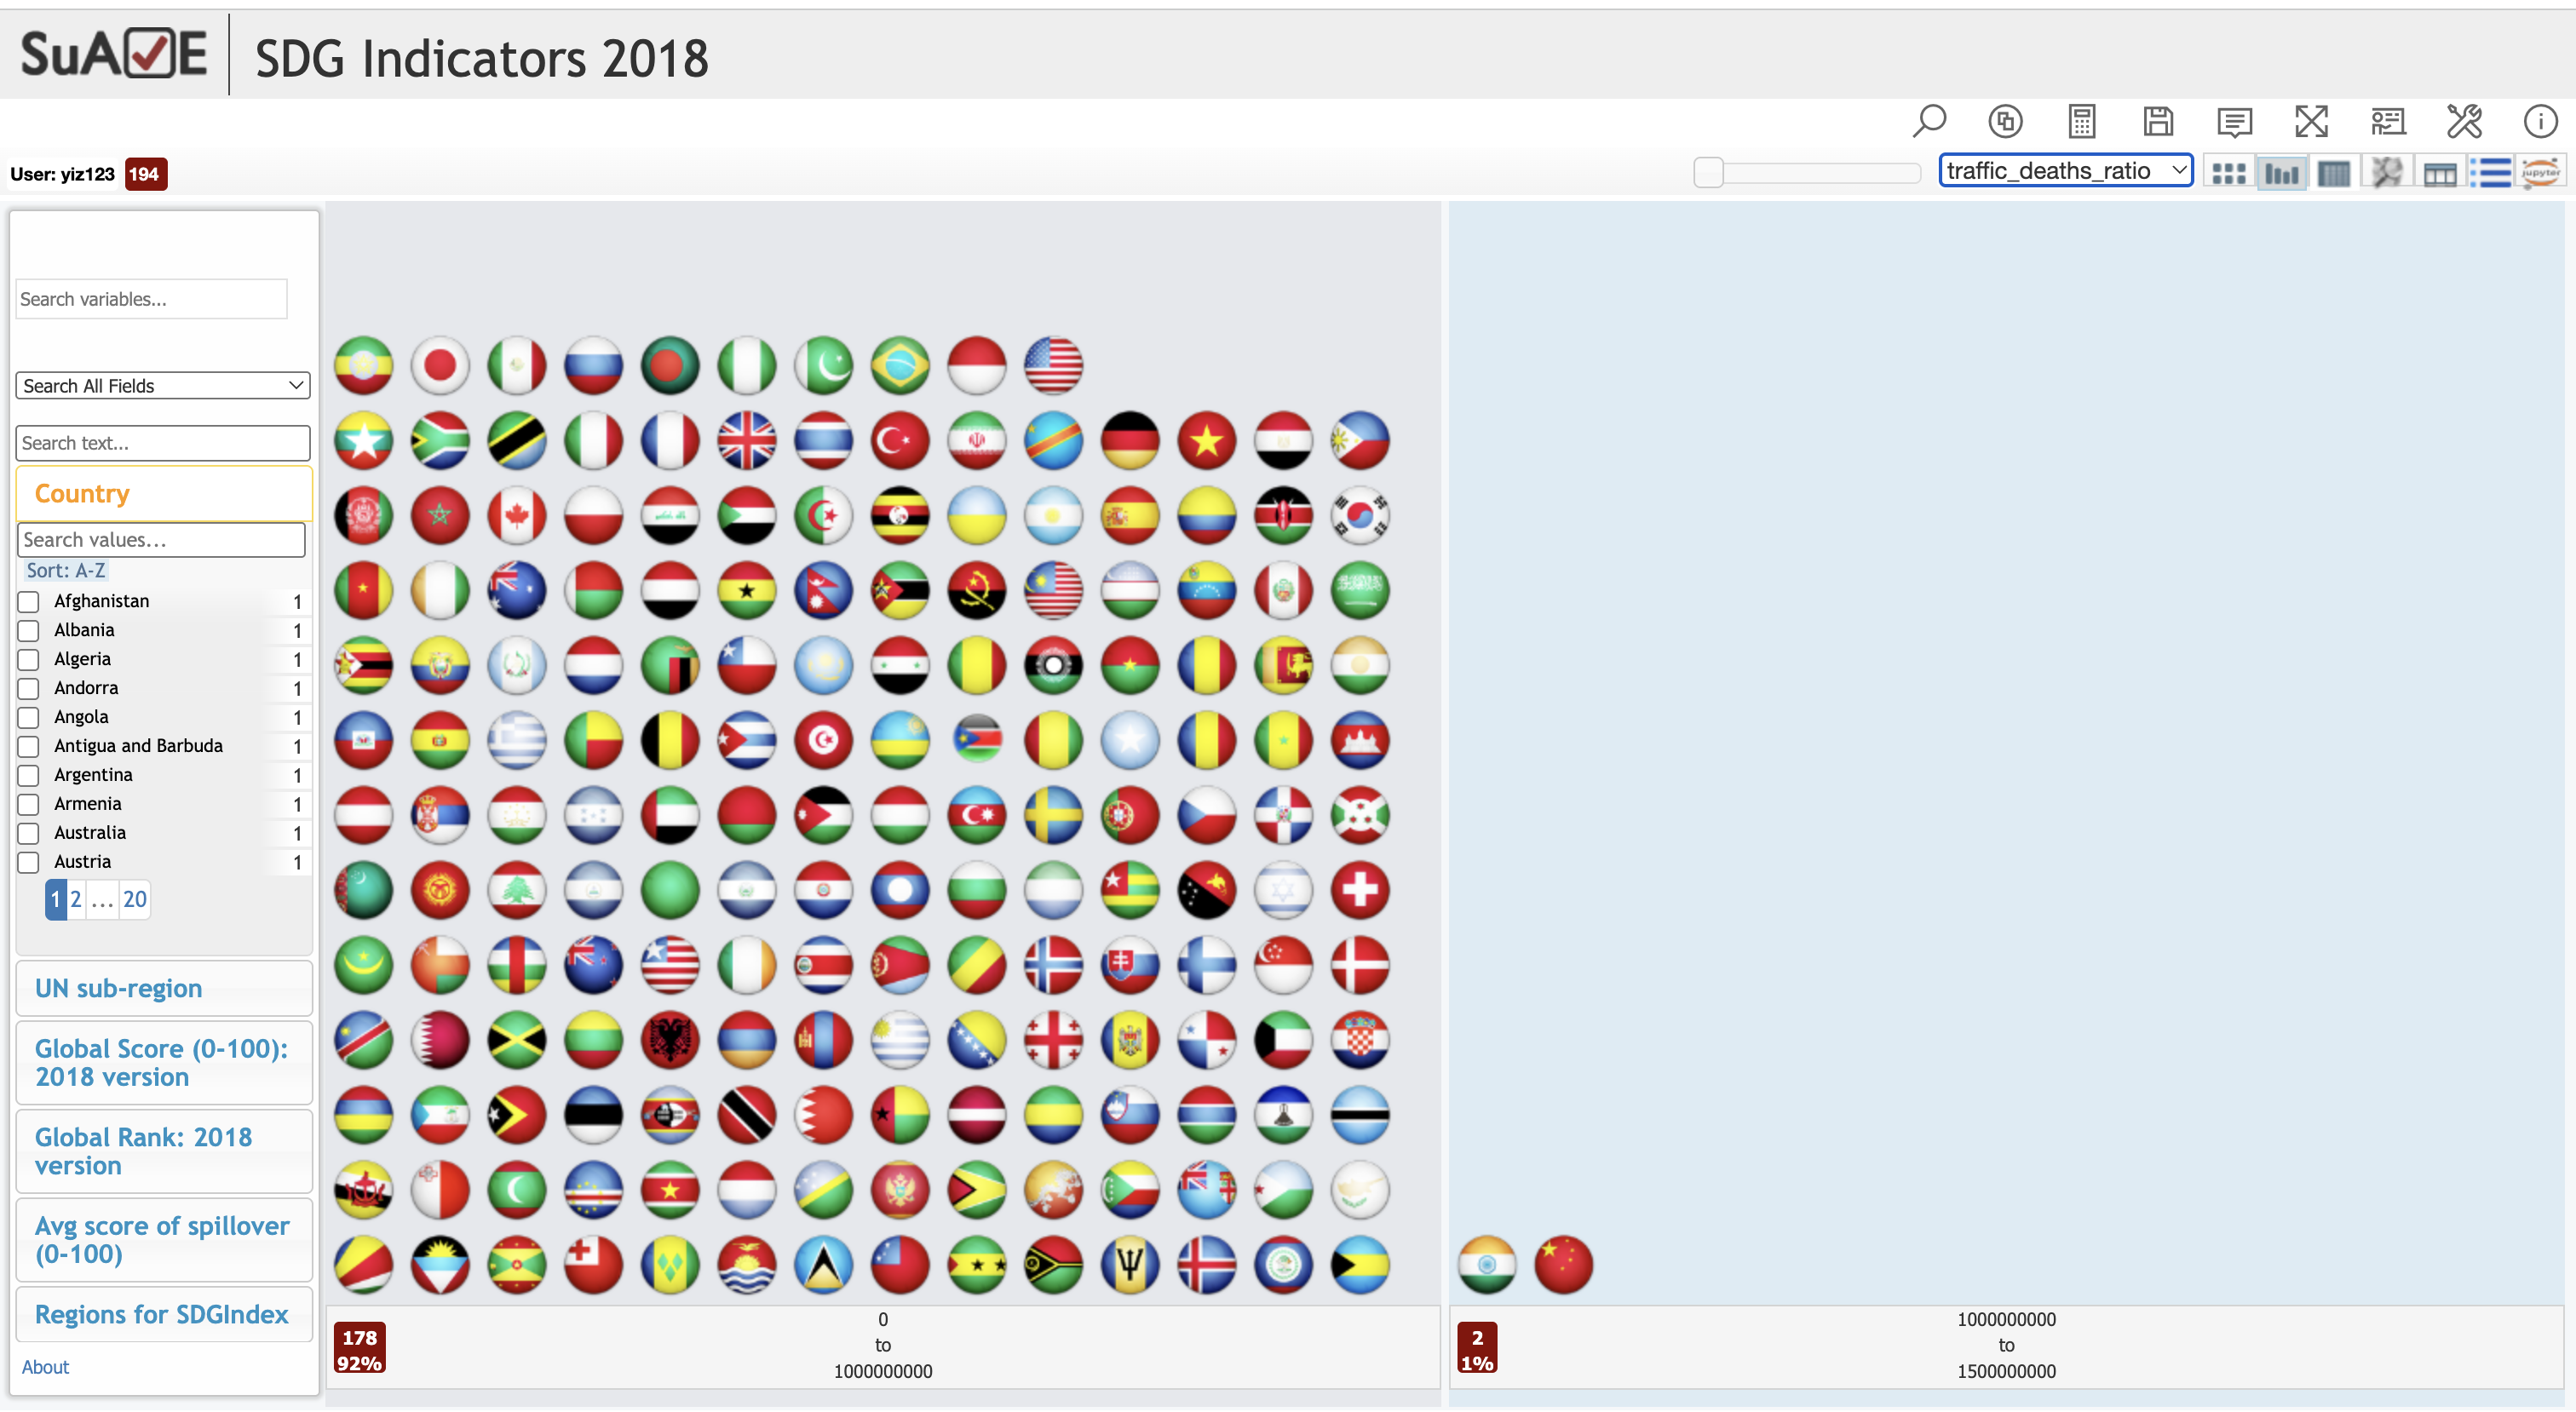
Example 3: Road Safety Indicator
- Variables:
- Traffic deaths (per 100,000)
- Population in 2017
- Formula:
traffic_deaths_ratio = Traffic deaths / Population - Interpretation:
A proxy for traffic death burden per person.
Saving and Viewing Results
If you want to save the result variables to the survey, you can click on the Save button located at the top right of the page.
To review what you’ve written for the new variable, click the dropdown in the upper right corner. This allows you to see your computed facets.