User interface - network function
To explore relationships between elements as a network, use the network view icon located in the toolbar:
![]()
Clicking the last icon (a network graph symbol) in the toolbar will switch the view to network mode, where connected elements are visualized as nodes and links. This helps you explore structural patterns such as clusters, collaborations, and connections.
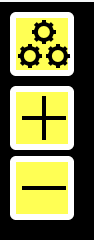
To customize the network display, click on the gear icon:
This opens the Netvis Controls and Info panel shown below:
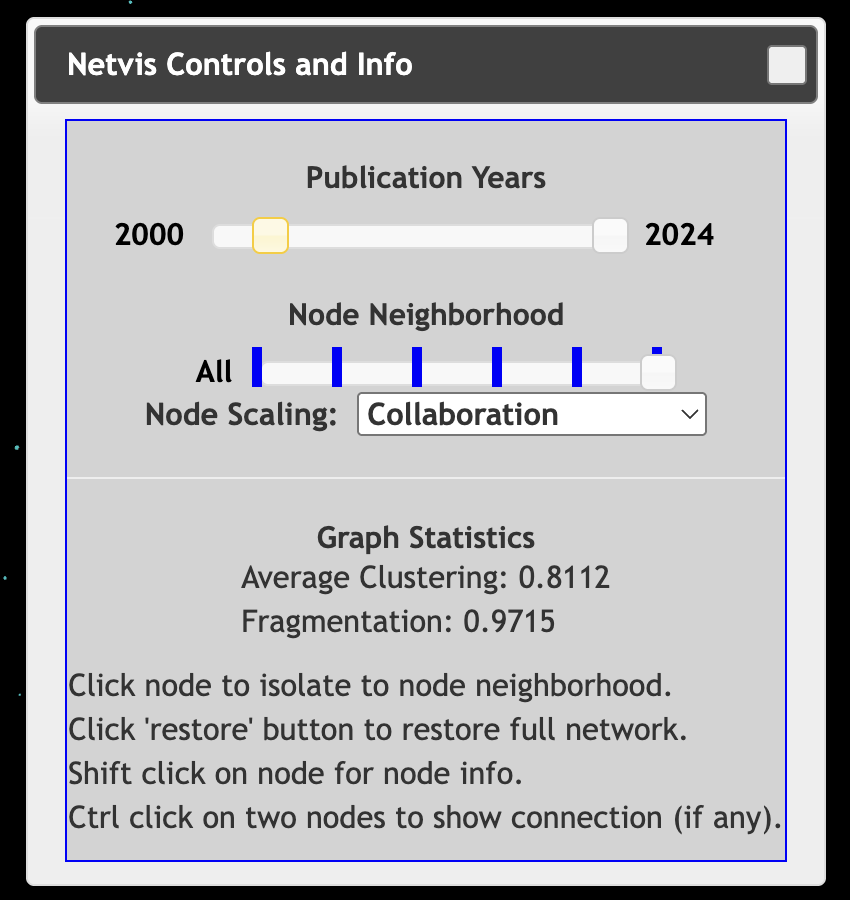
Netvis Controls and Settings
Inside the panel, you can control various aspects of the graph:
- Publication Years: Use the slider to filter the graph by publication year range (e.g., 2000 to 2024).
- Node Neighborhood: Limit the visualization to immediate or broader node connections using the slider.
- Node Scaling: Choose what attribute to scale node sizes by (e.g., Collaboration).
- Graph Statistics:
- Average Clustering: Displays the average clustering coefficient of the network.
- Fragmentation: Shows the network fragmentation score.
Interaction Tips
- Click a node to isolate it and highlight its neighborhood.
- Shift + Click a node to display detailed node information.
- Ctrl + Click two nodes to check if a direct connection exists between them.
- Click “Restore” to reset the full network view.
Zooming In and Out
In the panel below the gear icon:
- Click the + (plus) button to zoom in on the network.
- Click the – (minus) button to zoom out for a wider view.
These controls allow for more flexible navigation within large or dense networks.