Part 5 (Optional but Recommended) - Creating SuAVE Visualization
What you’ll need:
- The link to the Google Spreadsheet created in the previous section
- A SuAVE Account
Navigate to https://suave-net.sdsc.edu. Login if you have an account; if not, create an account.
Ensure that you’re in the “Gallery Section” on the SuAVE Homepage. This can be accessed from the left navigation bar of the website.
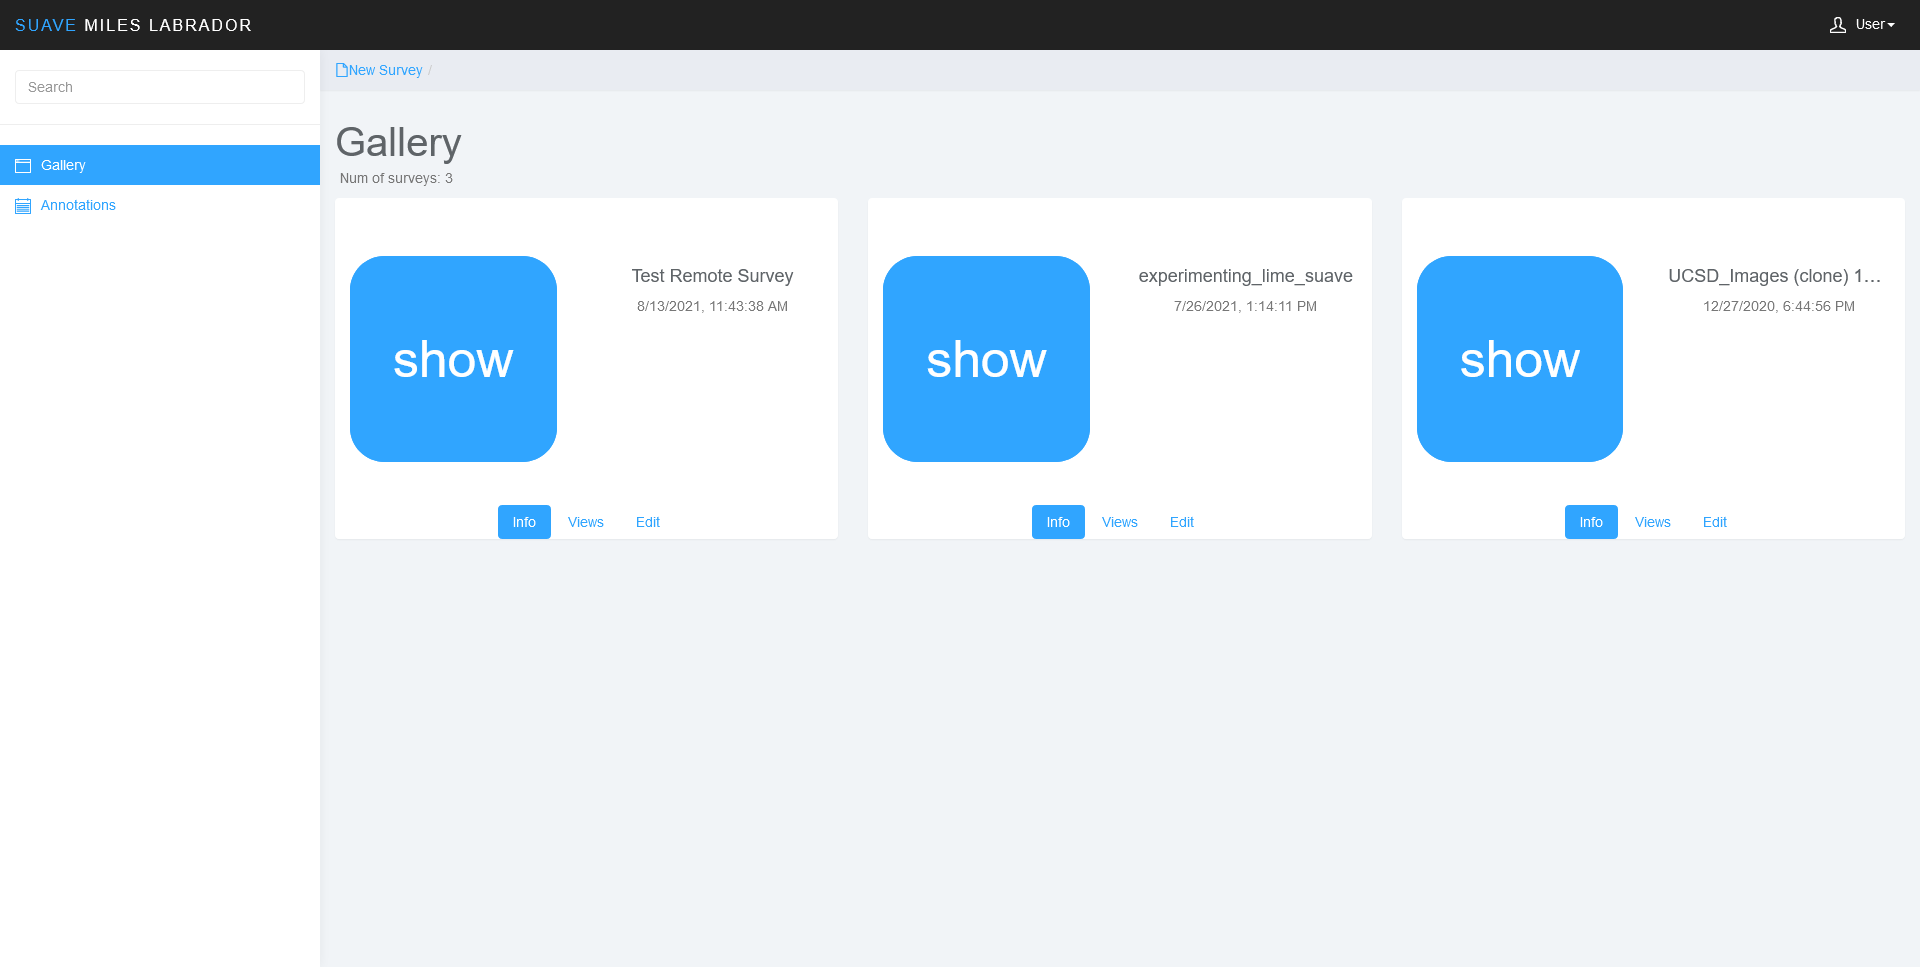
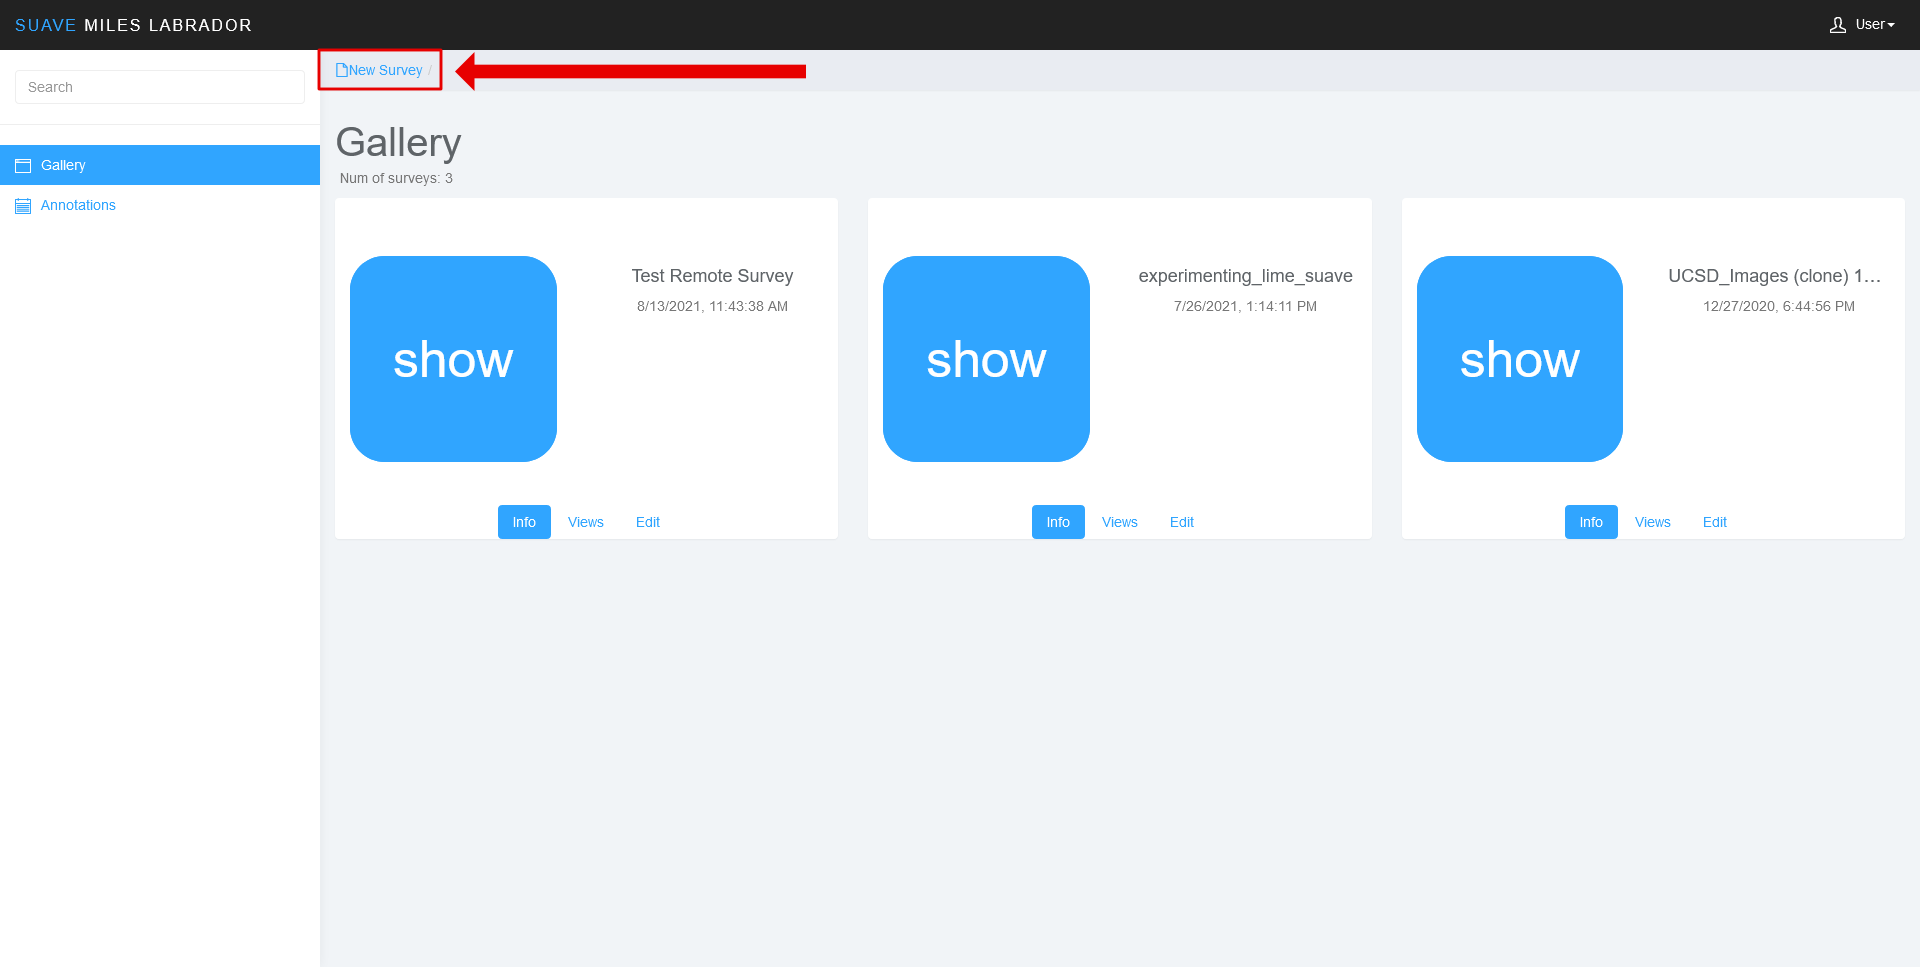
- Click the “New Survey” button on the top left of the gallery menu.
- You should be presented with a menu that looks like this:
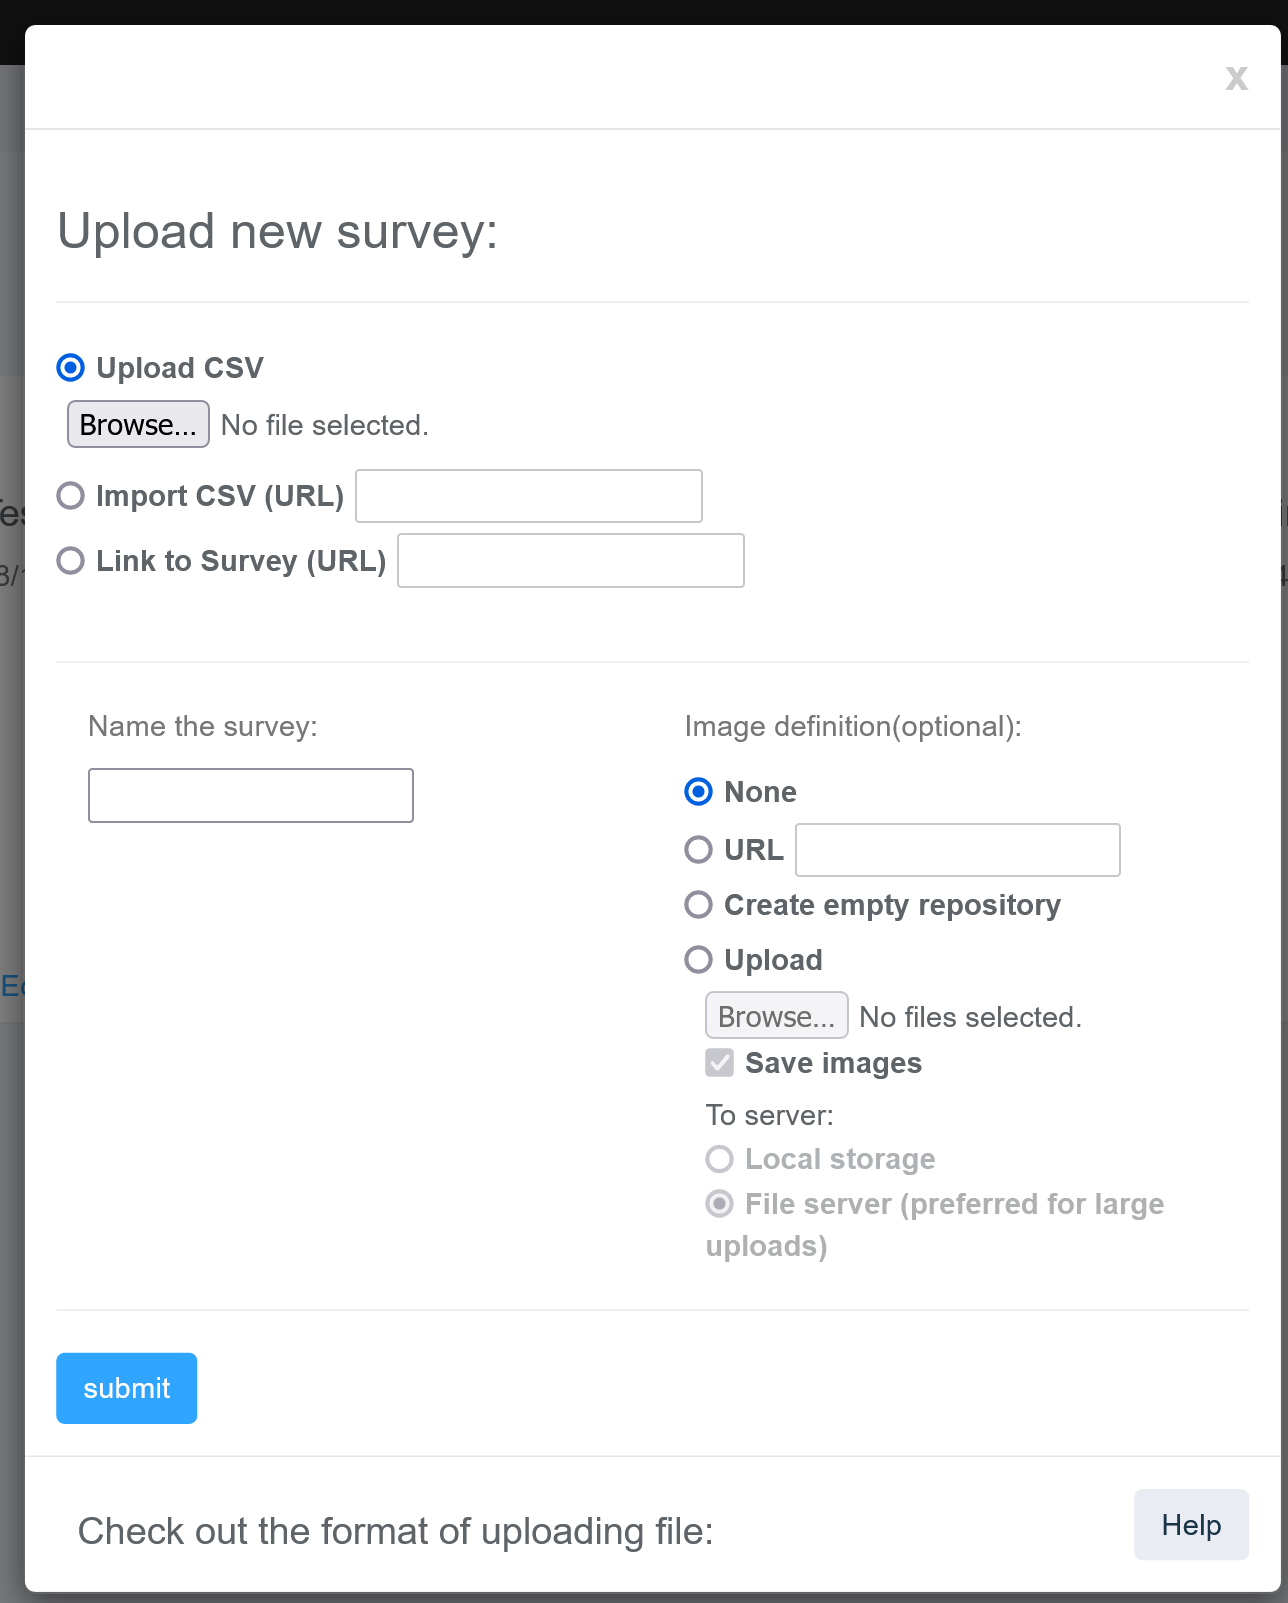
- In the following steps we’re going to configure the settings to connect it to our LimeSurvey survey and Google Spreadsheet.
Configuring your Survey
-
In order to connect our SuAVE survey to the survey that we created in LimeSurvey and Google Sheets, we are going to configure it using the following settings:
-
Name the survey:
- You can name your survey anything. It is recommended that the survey name is informative. It will appear at the top of your SuAVE visualization and cannot be changed later. Please make sure your title does not include apostrophes as this will cause the visualization to not display.
-
Link to Survey (URL)
- Grab the link from the Google Spreadsheet you created. It should look something like this:
https://docs.google.com/spreadsheets/d/[SPREADSHEET ID]/edit?usp=sharing- Edit the end of the link such that “/export?format=csv” comes after the spreadsheet ID. It should look like this now:
https://docs.google.com/spreadsheets/d/[SPREADSHEET ID]/export?format=csv- Select the “Link to Survey (URL)” option and insert your new link into the text box.
-
Image Definition
You must select “Create empty repository” in this field or else images from your survey will not be able to be accessed.
-
Your survey configuration should look something like this:
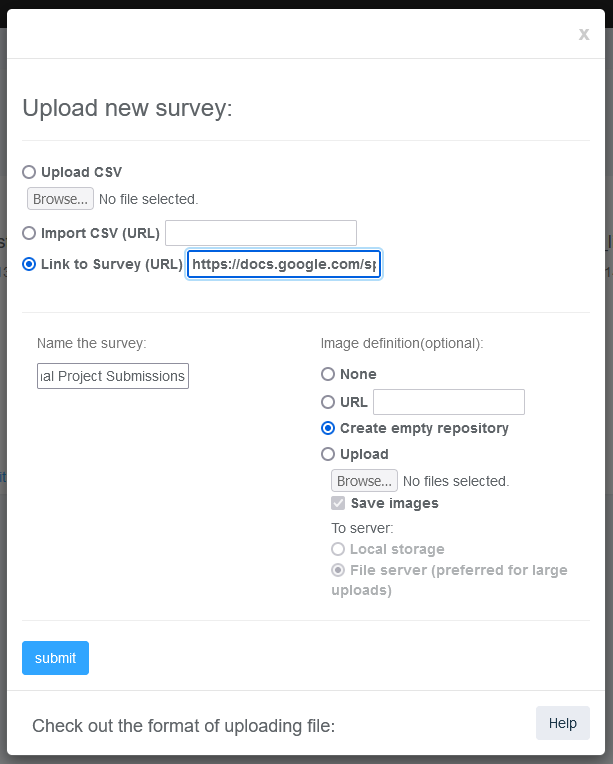
- Press “submit”
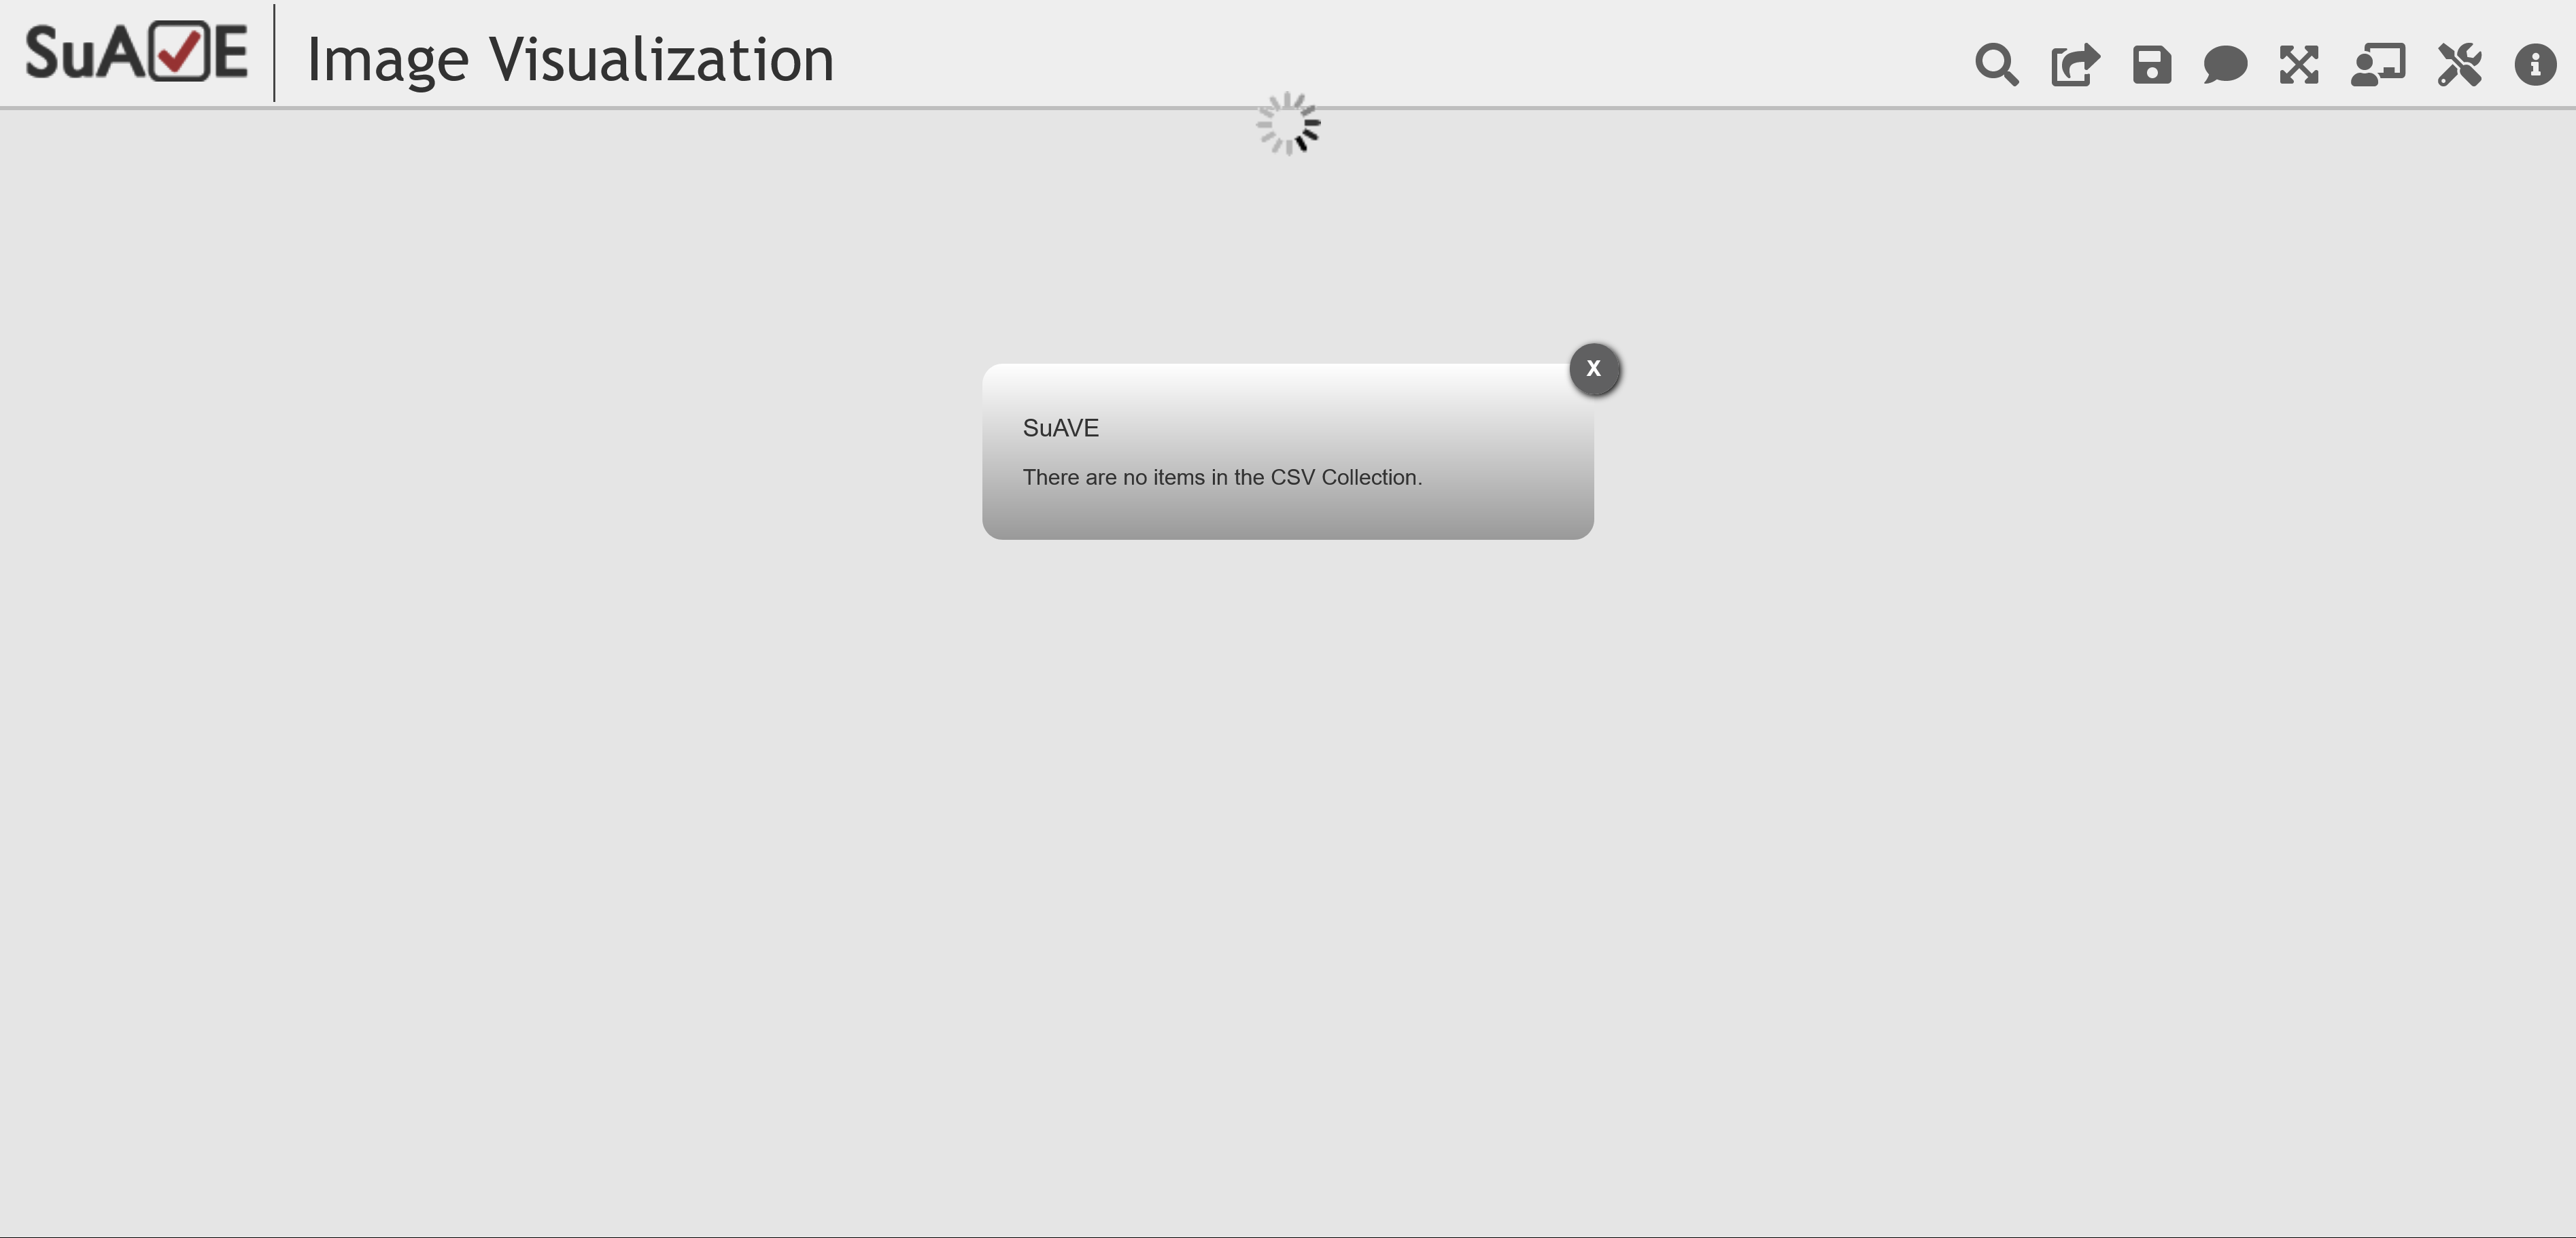
Note: Nothing will appear in the survey until there are responses that are submitted to the survey. If there are no responses you will get the error below, but do not worry. This does not mean that the survey creation failed.
- If you want participants of the questionnaire to see the SuAVE visualization, navigate back to Limesurvey; go to “Text Elements” and link the SuAVE visualization URL in the “End message”.
Checkpoint
- By now you should have a link to a Google Spreadsheet, Limesurvey questionnaire, and SuAVE visualization.
Checklist
- [ ] Google Spreadsheet Link
- [ ] Limesurvey Questionnaire
- [ ] SuAVE Visualization
Testing
Test that everything is in sync. Fill out the questionnaire a couple more times. These responses should now populate in the Google Sheet dataset and then the SuAVE visualization. If the responses do not show up in SuAVE and the Google Sheet, then it is a mapping issue. If the response do not populate in the SuAVE visualization only, then it is an issue between the Google Sheet and SuAVE. Fix the issue and then you are ready to publish the questionnaire.